 RSS Feed (xml)
Turtle Turtle is a file fixer software that provides several functions like replacing plain text/pattern from one or multiple files, removing invalid characters from file names and stripping comments from source files etc.
[Note: This Software is available for free]
DOWNLOAD
Showing posts with label others. Show all posts
Showing posts with label others. Show all posts
Friday, May 30, 2008
Turtle 1.0 Interview question
DotNet Framework & IIS installation order Interview question
If you ever install the dot net framework before the IIS, then your aspx pages would not work. The solution to this problem is that:
open the command prompt [For windows Xp and greater]
>>cd C:\WINDOWS\Microsoft.NET\Framework\v1.1.4322
>>aspnet_regiis.exe -i
In case you are using any other windows then search the aspnet_regiis.exe file and run this file from the command prompt with -i argument.
Note: Today one of my friend asked me about this problem and he told me that he is unable to find any solution of this problem on the net, so i though of publishing it on my blog. Hope it will help many.
Thursday, May 29, 2008
AJAX : Todays Buzzword Interview question
AJAX : Todays Buzzword
AJAX: Today becoming very common, and you will see lot of people talking about it. Microsoft has also launched an ATLAS Framework which is the implementation of AJAX.
What AJAX is all about??
Want to get the bigger picture, I hope these slide will help you a lot, If not then do write to me for any assistence.
What is .Resx file in Dot Net? Interview question
What is .Resx file in Dot Net??
It is an XML based file, with key value pair.
Reading from .Resx File:
You can access the .Resx file using this code:
ResXResourceReader reader = new ResXResourceReader(Server.MapPath("test.resx"));
IDictionaryEnumerator rsxr = reader.GetEnumerator();
foreach (DictionaryEntry d in reader)
{
Console.WriteLine(d.Key.ToString() + ":\t" + d.Value.ToString());
}
//Close the reader.
reader.Close();
Writing to .Resx File:
We can write the binary data of an image to the .Resx file using the following code
Image img = Image.FromFile("urdu.jpg");
ResXResourceWriter rsxw = new ResXResourceWriter("urdu.resx");
rsxw.AddResource("urdu.jpg",img);
rsxw.Close();
Use of .Resx File:
It is very useful while working on Localized project [Multiple Languages], You can make different resource files for different languages and depending upon the user choice you can change the Language of the application.
How to use Microsoft Indexing Service? Interview question
Using Microsoft Indexing Service:
Want to add document search in your application, you can use microsoft indexing service to do that. You can create a Catlog in the Microsoft indexing service on the folder whose document you want to search from your application. I will guide you on how to use microsoft indexing service from your ASP.NET page.
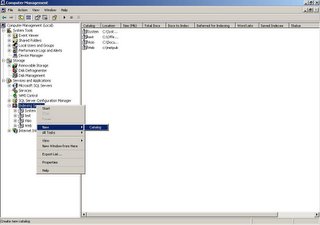
Go to Computer Management->Services and Application->Indexing Service and make sure that it is running.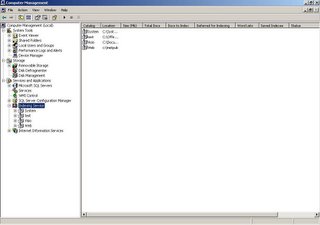
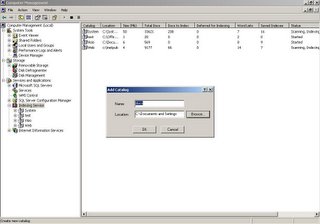
You can create a new Catalg by Right Clicking the 'Indexing Service'. You can give a name to the catalog and browse to the folder which you want to be indexed by this catalog.
MS Indexing Service + ASP.NET
Creating an ASP.NET page that can query from the MS Indexing service, I will use the 'Web' catalog that is created by deafult by the indesing service on the 'c:\inetpub\wwwroot\' folder.
We can connect to the MS Indexing service through the following Connection String {"Provider=\"MSIDXS.1\";Data Source=;Integrated Security .="}
You can select the Name of the File, the path where it is located and some of the text from the file. {Select FileName,Path,Characterization from Scope()}
Code:
protected System.Data.OleDb.OleDbConnection oleDbConnection1;
this.oleDbConnection1.ConnectionString = "Provider=\"MSIDXS.1\";Data Source=Web;Integrated Security .=";
{You can change the 'Data Source' to the name of the catalog in which you want to search}
protected System.Data.OleDb.OleDbCommand oleDbSelectCommand3;
protected System.Data.OleDb.OleDbDataAdapter oleDbDataAdapter2;
this.oleDbSelectCommand3 = new System.Data.OleDb.OleDbCommand();
this.oleDbDataAdapter2 = new System.Data.OleDb.OleDbDataAdapter();
Posting data to another ASPX Page Interview question
One of the common problems faced by the JSP and ASP developers while developing application in ASP.NET is posting data to another ASPX page. By Default if you have a server side form tag in an aspx page then it will post the data to the same page.
I Came across a very easy to understand article for doing this, hope it will also help you in understanding the concept.
Virtual Karma: Complete List of Web 2.0 Applications | Rian's blog Interview question
Virtual Karma: Complete List of Web 2.0 Applications | Rian's blog
Some Useful Web Links Interview question
Hi,
One of my colleague accumulated a list of useful links on the web , i have uploaded that document on the Writely . It you want to collaborate on this document to add more useful links, please send me your email address so that i can add you in the collaborator list.
Its URL is:
http://www.writely.com/Doc.aspx?id=bcsw8fz74pf
Hope it will be useful for you you guys.
Acknowledgments:
Adeel Anwar
ASP.NET 2.0 Magic: Asynchronous Web Pages Interview question
The classic and inherently synchronous processing model of ASP.NET pages is simply unfit. Asynchronous HTTP handlers have existed since ASP.NET 1.0, but the ASP.NET 2.0 provides an easy to use API for managing Asynchronous Web Pages. If we have an I/O incentive operation then the ASP.NET synchronous page is blocked waiting for the I/O to complete, which leaves the end user waiting. In case of asynchronous access the execution of page is divided in to two segment, one when the execution starts and the other when the task is done, these two task works in separate threads.
We can set an asp.net page to execute asynchronously by setting up the Async tag in the Page declaration of the ASP.NET Page.
<%@ Page Async="true" ... %>
This reference on the MSDN will be helpful in understanding it in details.
Monday, May 19, 2008
LoadRunner Interview Questions
1. What is load testing? - Load testing is to test that if the application works fine with the loads that result from large number of simultaneous users, transactions and to determine weather it can handle peak usage periods.
What is Performance testing? - Timing for both read and update transactions should be gathered to determine whether system functions are being performed in an acceptable timeframe. This should be done standalone and then in a multi user environment to determine the effect of multiple transactions on the timing of a single transaction.
Did u use Load Runner? What version? - Yes. Version 8.0.
Explain the Load testing process? Step 1: Planning the test. Here, we develop a clearly defined test plan to ensure the test scenarios we develop will accomplish load-testing objectives.
Step 2: Creating Vusers. Here, we create Vuser scripts that contain tasks performed by each Vuser, tasks performed by Vusers as a whole, and tasks measured as transactions.
Step 3: Creating the scenario. A scenario describes the events that occur during a testing session. It includes a list of machines, scripts, and Vusers that run during the scenario. We create scenarios using LoadRunner Controller. We can create manual scenarios as well as goal-oriented scenarios. In manual scenarios, we define the number of Vusers, the load generator machines, and percentage of Vusers to be assigned to each script. For web tests, we may create a goal-oriented scenario where we define the goal that our test has to achieve. LoadRunner automatically builds a scenario for us.
Step4: Runningthescenario.We emulate load on the server by instructing multiple Vusers to perform tasks simultaneously. Before the testing, we set the scenario configuration and scheduling. We can run the entire scenario, Vuser groups, or individual Vusers.
Step5: Monitoring the scenario.We monitor scenario execution using the LoadRunner online runtime, transaction, system resource, Web resource, Web server resource, Web application server resource, database server resource, network delay, streaming media resource, firewall server resource, ERP server resource, and Java performance monitors.
Step 6: Analyzing test results. During scenario execution, LoadRunner records the performance of the application under different loads. We use Load Runner’s graphs and reports to analyze the application’s performance.
When do you do load and performance Testing? - We perform load testing once we are done with interface (GUI) testing. Modern system architectures are large and complex. Whereas single user testing primarily on functionality and user interface of a system component, application testing focuses on performance and reliability of an entire system. For example, typical application-testing scenario might depict 1000 users logging in simultaneously to a system. This gives rise to issues such as what is the response time of the system, does it crash, will it go with different software applications and platforms, can it hold so many hundreds and thousands of users, etc. This is when we set do load and performance testing.
What are the components of LoadRunner? - The components of LoadRunner are The Virtual User Generator, Controller, and the Agent process, LoadRunner Analysis and Monitoring, LoadRunner Books Online.
What Component of LoadRunner would you use to record a Script? - The Virtual User Generator (VuGen) component is used to record a script. It enables you to develop Vuser scripts for a variety of application types and communication protocols.
What Component of LoadRunner would you use to play Back the script in multi user mode? - The Controller component is used to playback the script in multi-user mode. This is done during a scenario run where a vuser script is executed by a number of vusers in a group.
What is a rendezvous point? - You insert rendezvous points into Vuser scripts to emulate heavy user load on the server. Rendezvous points instruct Vusers to wait during test execution for multiple Vusers to arrive at a certain point, in order that they may simultaneously perform a task. For example, to emulate peak load on the bank server, you can insert a rendezvous point instructing 100 Vusers to deposit cash into their accounts at the same time.
What is a scenario? - A scenario defines the events that occur during each testing session. For example, a scenario defines and controls the number of users to emulate, the actions to be performed, and the machines on which the virtual users run their emulations.
Explain the recording mode for web Vuser script? - We use VuGen to develop a Vuser script by recording a user performing typical business processes on a client application. VuGen creates the script by recording the activity between the client and the server. For example, in web based applications, VuGen monitors the client end of the database and traces all the requests sent to, and received from, the database server. We use VuGen to: Monitor the communication between the application and the server; Generate the required function calls; and Insert the generated function calls into a Vuser script.
Why do you create parameters? - Parameters are like script variables. They are used to vary input to the server and to emulate real users. Different sets of data are sent to the server each time the script is run. Better simulate the usage model for more accurate testing from the Controller; one script can emulate many different users on the system.
What is correlation? Explain the difference between automatic correlation and manual correlation? - Correlation is used to obtain data which are unique for each run of the script and which are generated by nested queries. Correlation provides the value to avoid errors arising out of duplicate values and also optimizing the code (to avoid nested queries). Automatic correlation is where we set some rules for correlation. It can be application server specific. Here values are replaced by data which are created by these rules. In manual correlation, the value we want to correlate is scanned and create correlation is used to correlate.
How do you find out where correlation is required? Give few examples from your projects? - Two ways: First we can scan for correlations, and see the list of values which can be correlated. From this we can pick a value to be correlated. Secondly, we can record two scripts and compare them. We can look up the difference file to see for the values which needed to be correlated. In my project, there was a unique id developed for each customer, it was nothing but Insurance Number, it was generated automatically and it was sequential and this value was unique. I had to correlate this value, in order to avoid errors while running my script. I did using scan for correlation.
Where do you set automatic correlation options? - Automatic correlation from web point of view can be set in recording options and correlation tab. Here we can enable correlation for the entire script and choose either issue online messages or offline actions, where we can define rules for that correlation. Automatic correlation for database can be done using show output window and scan for correlation and picking the correlate query tab and choose which query value we want to correlate. If we know the specific value to be correlated, we just do create correlation for the value and specify how the value to be created.
What is a function to capture dynamic values in the web Vuser script? - Web_reg_save_param function saves dynamic data information to a parameter.
When do you disable log in Virtual User Generator, When do you choose standard and extended logs? - Once we debug our script and verify that it is functional, we can enable logging for errors only. When we add a script to a scenario, logging is automatically disabled. Standard Log Option: When you selectStandard log, it creates a standard log of functions and messages sent during script execution to use for debugging. Disable this option for large load testing scenarios. When you copy a script to a scenario, logging is automatically disabled Extended Log Option: Selectextended log to create an extended log, including warnings and other messages. Disable this option for large load testing scenarios. When you copy a script to a scenario, logging is automatically disabled. We can specify which additional information should be added to the extended log using the Extended log options.
How do you debug a LoadRunner script? - VuGen contains two options to help debug Vuser scripts-the Run Step by Step command and breakpoints. The Debug settings in the Options dialog box allow us to determine the extent of the trace to be performed during scenario execution. The debug information is written to the Output window. We can manually set the message class within your script using the lr_set_debug_message function. This is useful if we want to receive debug information about a small section of the script only.
How do you write user defined functions in LR? Give me few functions you wrote in your previous project? - Before we create the User Defined functions we need to create the externallibrary (DLL) with the function. We add this library to VuGen bin directory. Once the library is added then we assign user defined function as a parameter. The function should have the following format: __declspec (dllexport) char*
What are the changes you can make in run-time settings? - The Run Time Settings that we make are: a) Pacing - It has iteration count. b) Log - Under this we have Disable Logging Standard Log and c) Extended Think Time - In think time we have two options like Ignore think time and Replay think time. d) General - Under general tab we can set the vusers as process or as multithreading and whether each step as a transaction.
Where do you set Iteration for Vuser testing? - We set Iterations in the Run Time Settings of the VuGen. The navigation for this is Run time settings, Pacing tab, set number of iterations.
How do you perform functional testing under load? - Functionality under load can be tested by running several Vusers concurrently. By increasing the amount of Vusers, we can determine how much load the server can sustain.
What is Ramp up? How do you set this? - This option is used to gradually increase the amount of Vusers/load on the server. An initial value is set and a value to wait between intervals can bespecified. To set Ramp Up, go to ‘Scenario Scheduling Options’
What is the advantage of running the Vuser as thread? - VuGen provides the facility to use multithreading. This enables more Vusers to be run pergenerator. If the Vuser is run as a process, the same driver program is loaded into memory for each Vuser, thus taking up a large amount of memory. This limits the number of Vusers that can be run on a singlegenerator. If the Vuser is run as a thread, only one instance of the driver program is loaded into memory for the given number ofVusers (say 100). Each thread shares the memory of the parent driver program, thus enabling more Vusers to be run per generator.
If you want to stop the execution of your script on error, how do you do that? - The lr_abort function aborts the execution of a Vuser script. It instructs the Vuser to stop executing the Actions section, execute the vuser_end section and end the execution. This function is useful when you need to manually abort a script execution as a result of a specific error condition. When you end a script using this function, the Vuser is assigned the status "Stopped". For this to take effect, we have to first uncheck the “Continue on error” option in Run-Time Settings.
What is the relation between Response Time and Throughput? - The Throughput graph shows the amount of data in bytes that the Vusers received from the server in a second. When we compare this with the transaction response time, we will notice that as throughput decreased, the response time also decreased. Similarly, the peak throughput and highest response time would occur approximately at the same time.
Explain the Configuration of your systems? - The configuration of our systems refers to that of the client machines on which we run the Vusers. The configuration of any client machine includes its hardware settings, memory, operating system, software applications, development tools, etc. This system component configuration should match with the overall system configuration that would include the network infrastructure, the web server, the database server, and any other components that go with this larger system so as to achieve the load testing objectives.
How do you identify the performance bottlenecks? - Performance Bottlenecks can be detected by using monitors. These monitors might be application server monitors, web server monitors, database server monitors and network monitors. They help in finding out the troubled area in our scenario which causes increased response time. The measurements made are usually performance response time, throughput, hits/sec, network delay graphs, etc.
If web server, database and Network are all fine where could be the problem? - The problem could be in the system itself or in the application server or in the code written for the application.
How did you find web server related issues? - Using Web resource monitors we can find the performance of web servers. Using these monitors we can analyze throughput on the web server, number of hits per second thatoccurred during scenario, the number of http responses per second, the number of downloaded pages per second.
How did you find database related issues? - By running “Database” monitor and help of “Data Resource Graph” we can find database related issues. E.g. You can specify the resource you want to measure on before running the controller and than you can see database related issues
Explain all the web recording options?
What is the difference between Overlay graph and Correlate graph? - Overlay Graph: It overlay the content of two graphs that shares a common x-axis. Left Y-axis on the merged graph show’s the current graph’s value & Right Y-axis show the value of Y-axis of the graph that was merged. Correlate Graph: Plot the Y-axis of two graphs against each other. The active graph’s Y-axis becomes X-axis of merged graph. Y-axis of the graph that was merged becomes merged graph’s Y-axis.
How did you plan the Load? What are the Criteria? - Load test is planned to decide the number of users, what kind of machines we are going to use and from where they are run. It is based on 2 important documents, Task Distribution Diagram and Transaction profile. Task Distribution Diagram gives us the information on number of users for a particular transaction and the time of the load. The peak usage and off-usage are decided from this Diagram. Transaction profile gives us the information about the transactions name and their priority levels with regard to the scenario we are deciding.
What does vuser_init action contain? - Vuser_init action contains procedures to login to a server.
What does vuser_end action contain? - Vuser_end section contains log off procedures.
What is think time? How do you change the threshold? - Think time is the time that a real user waits between actions. Example: When a user receives data from a server, the user may wait several seconds to review the data before responding. This delay is known as the think time. Changing the Threshold: Threshold level is the level below which the recorded think time will be ignored. The default value is five (5) seconds. We can change the think time threshold in the Recording options of the Vugen.
What is the difference between standard log and extended log? - The standard log sends a subset of functions and messages sent during script execution to a log. The subset depends on the Vuser type Extended log sends a detailed script execution messages to the output log. This is mainly used during debugging when we want information about: Parameter substitution. Data returned by the server. Advanced trace.
Explain the following functions: - lr_debug_message - The lr_debug_message function sends a debug message to the output log when the specified message class is set. lr_output_message - The lr_output_message function sends notifications to the Controller Output window and the Vuser log file. lr_error_message - The lr_error_message function sends an error message to the LoadRunner Output window. lrd_stmt - The lrd_stmt function associates a character string (usually a SQL statement) with a cursor. This function sets a SQL statement to be processed. lrd_fetch - The lrd_fetch function fetches the next row from the result set.
Throughput - If the throughput scales upward as time progresses and the number of Vusers increase, this indicates that the bandwidth is sufficient. If the graph were to remain relatively flat as the number of Vusers increased, it wouldbe reasonable to conclude that the bandwidth is constraining the volume ofdata delivered.
Types of Goals in Goal-Oriented Scenario - Load Runner provides you with five different types of goals in a goal oriented scenario:
The number of concurrent Vusers
The number of hits per second
The number of transactions per second
The number of pages per minute
The transaction response time that you want your scenario
Analysis Scenario (Bottlenecks): In Running Vuser graph correlated with the response time graph you can see that as the number of Vusers increases, the average response time of the check itinerary transaction very gradually increases. In other words, the average response time steadily increases as the loadincreases. At 56 Vusers, there is a sudden, sharp increase in the average responsetime. We say that the test broke the server. That is the mean time before failure (MTBF). The response time clearly began to degrade when there were more than 56 Vusers running simultaneously.
What is correlation? Explain the difference between automatic correlation and manual correlation? - Correlation is used to obtain data which are unique for each run of the script and which are generated by nested queries. Correlation provides the value to avoid errors arising out of duplicate values and also optimizing the code (to avoid nested queries). Automatic correlation is where we set some rules for correlation. It can be application server specific. Here values are replaced by data which are created by these rules. In manual correlation, the value we want to correlate is scanned and create correlation is used to correlate.
Where do you set automatic correlation options? - Automatic correlation from web point of view, can be set in recording options and correlation tab. Here we can enable correlation for the entire script and choose either issue online messages or offline actions, where we can define rules for that correlation. Automatic correlation for database, can be done using show output window and scan for correlation and picking the correlate query tab and choose which query value we want to correlate. If we know the specific value to be correlated, we just do create correlation for the value and specify how the value to be created. What is a function to capture dynamic values in the web vuser script? - Web_reg_save_param function saves dynamic data information to a parameter.
C Interview Quetions
Here is a consolidated list of all the C interview questions on Interview Helper:
- C Interview Questions - Part 1
- C Interview Questions - Part 2
- C Interview Questions - Part 3
- C Interview Questions Part - 4
- C Interview Questions Part - 5
- C Interview Questions - Part 6
- C Interview Questions - Part 7
- C Interview Questions - Part 8
- C Interview Questions - Part 9
- C Interview Questions - Part 10
- C Interview Questions - Part 11
- C Interview Questions - Part 12
- C Interview Questions - Part 13
- C Interview Questions - Part 14
Tuesday, May 6, 2008
GC will cause a program to pause. true or false?
TRUE to some extant. Its true that garbage collectors usually stop the entire program while seeking and collecting garbage objects, But these pauses are minimal and generally are not noticable in modern systems
What's the major difference between Java and .NET garbage collectors?
Sun left the implementation of a specific garbage collector up to the JRE developer, so their performance varies widely, depending on whose JRE you're using. Microsoft is standardized on their garbage collection.
Manual memory management will not make a program pause. true or false?
FALSE. Manual memory management may create more long pauses than that of GC.
What is the difference between the value-type variables and reference-type variables in terms of garbage collection?
The value-type variables are not garbage-collected, they just fall off the stack when they fall out of scope, the reference-type objects are picked up by GC when their references go null.
What is Code Access Security. How does it work?
CAS ( Code Access Security ) comes under the .NET security model that determines whether or not code is allowed to run, and what resources it can use when it is running. The CAS security policy revolves around two key concepts - code groups and permissions.
Each .NET assembly is a member of a particular code group, and each code group is granted the permissions specified in a named permission set.
Can you define your own CAS groups? if Yes, How?
Yes, we can define our own CAS groups. To see the code groups defined on any system, run 'caspol -lg' from the command-line tool.
to create our own CAS group we will use caspol. For example, suppose I trust code from www.abc.com and you want it have full access to myr system, but I want to keep the default restrictions for all other internet sites.
To achieve this, I would add a new code group as a sub-group of the 'Zone - Internet' group, like this: caspol -ag 1.3 -site www.abc.com FullTrust the new group will been added
What Tracing and debugging facility are given in .Net?
In the System.Diagnostics namespace. There are two main classes that deal with tracing - Debug and Trace. They both work similarly- the difference is that tracing from the Debug class only works in builds that have the DEBUG symbol defined, whereas tracing from the Trace class only works in builds that have the TRACE symbol defined.
Typically this means that we should use System.Diagnostics.Trace.WriteLine for tracing that we want to work in debug and release builds, and System.Diagnostics.Debug.WriteLine for tracing that we want to work only in debug builds.
we can trace the execution of an ASP.NET page by using the trace attribute of the page directive. To enable tracing for a single ASP.NET page, include the following directive at the top of the page:
<%@ Page Trace="True" %>
Can you redirect tracing to a file?
Yes. The Debug and Trace classes both have a Listeners property, which is a collection of sinks that receive the tracing that we send via Debug.WriteLine and Trace.WriteLine respectively.
What does assert() method do?
In debug compilation, assert method takes in a Boolean condition as a parameter, and shows the error dialog if the condition is false.
The program proceeds without any interruption if the condition is true.
Subscribe to:
Posts (Atom)